Every grow light datasheet now leads with a spectrum chart. Full spectrum. Sun-like. Optimized for photosynthesis. The marketing language is polished, the charts look scientific, and the price is suspiciously competitive. Here’s the problem: most of these spectrum claims are meaningless for actual crop performance.
After working with commercial indoor farming projects across North America and Europe for years, I’ve seen the same pattern repeat. Buyers get seduced by pretty spectral curves, then discover their lettuce yields are 30% below expected, or their tomato plants are all stem and no fruit. The spectrum chart told them nothing useful.
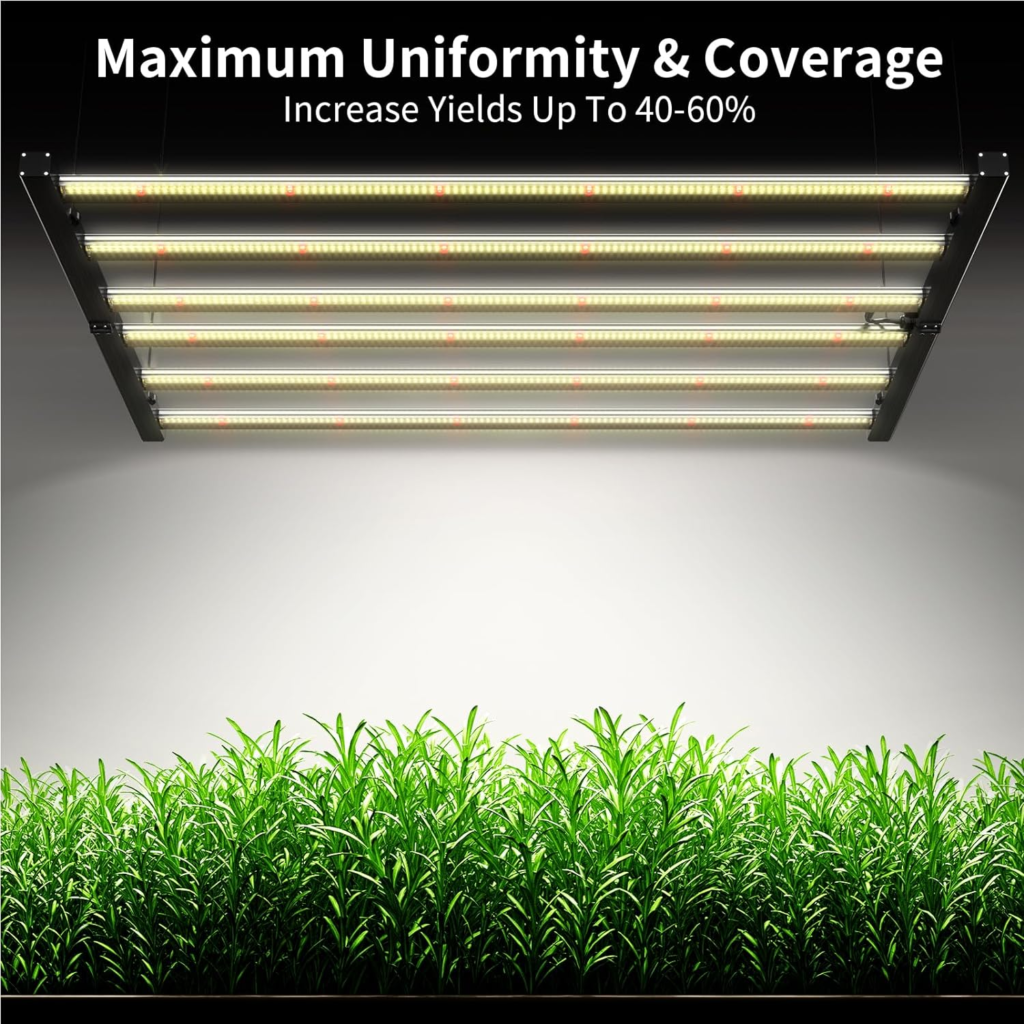
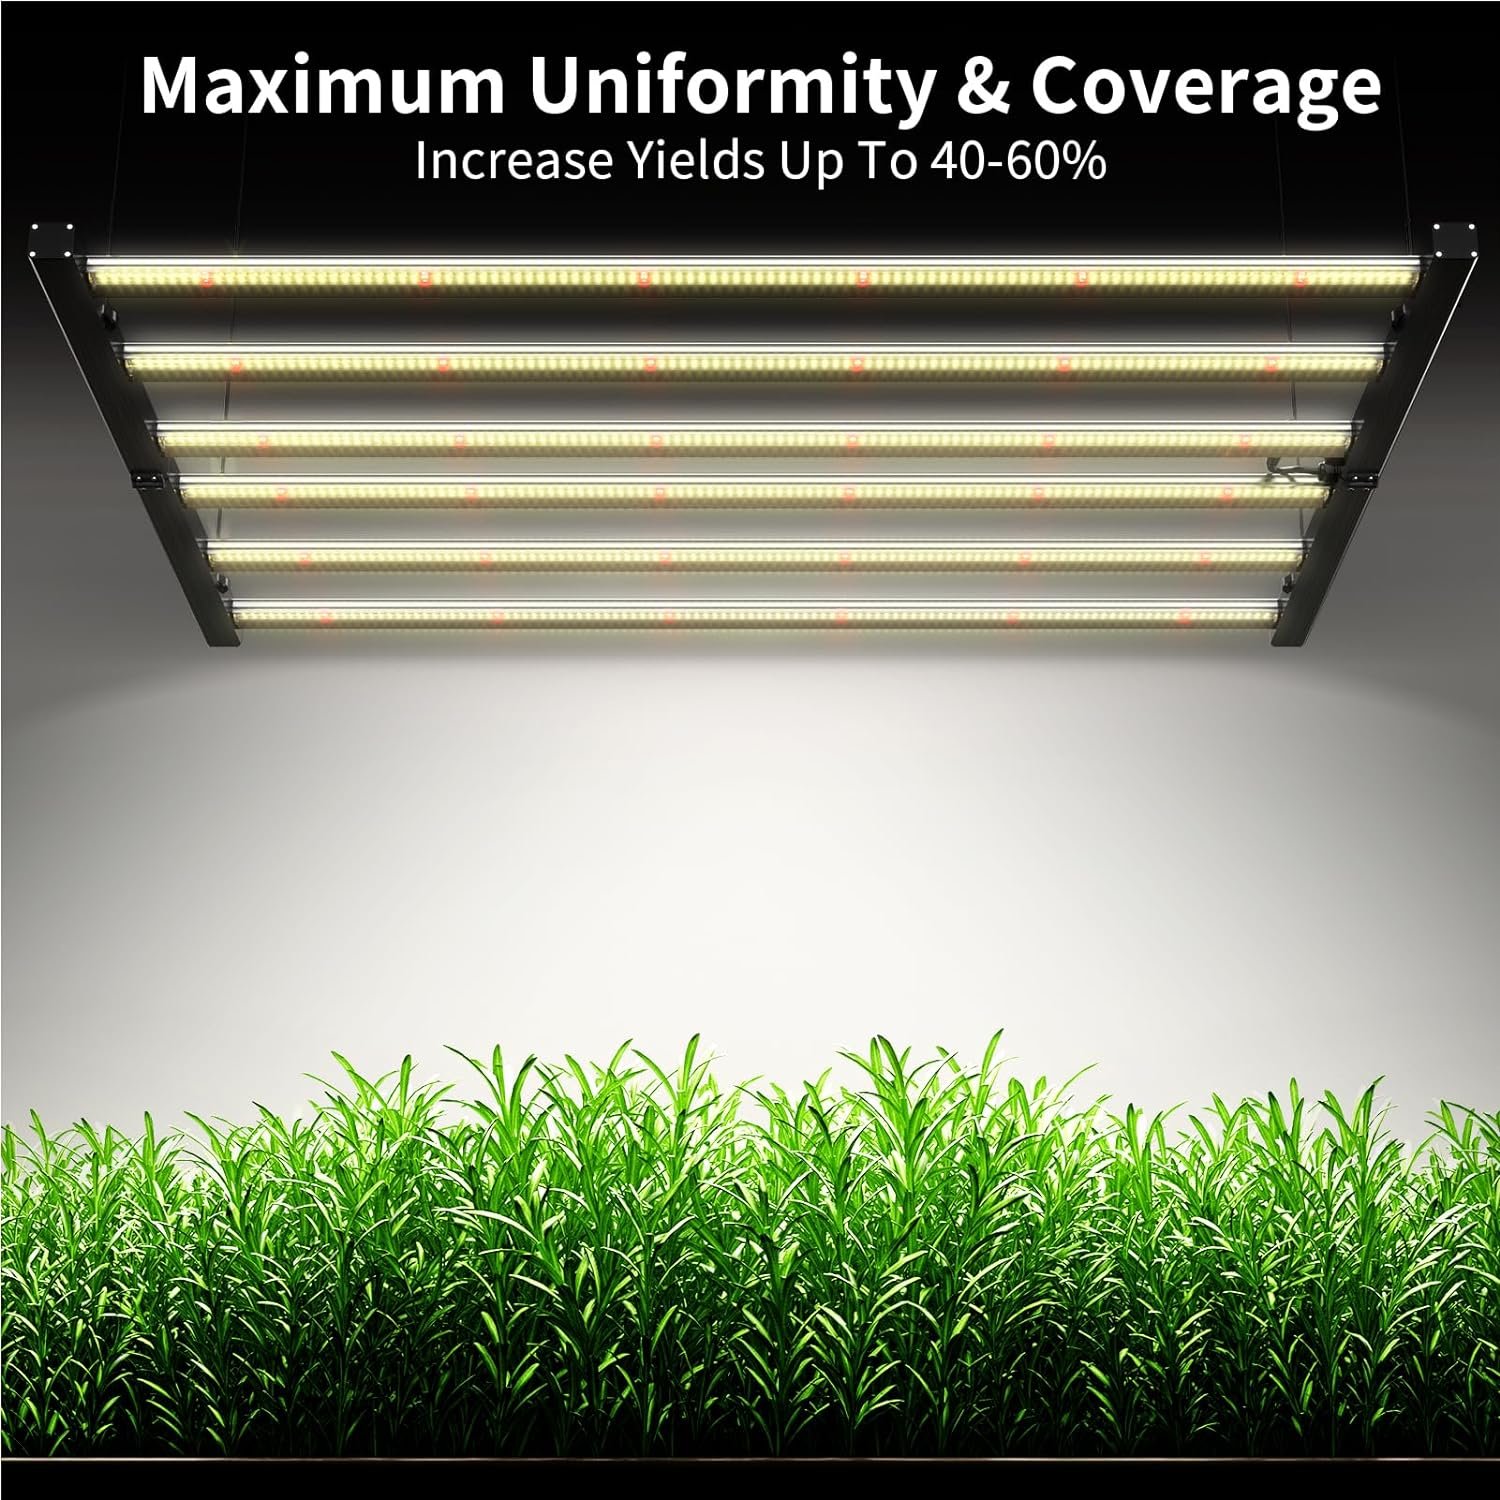
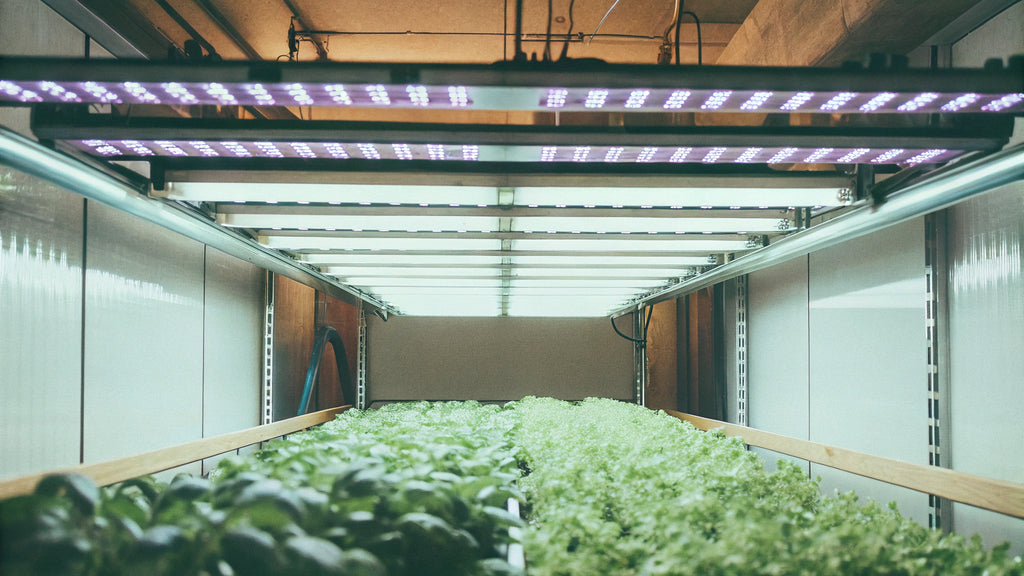
Commercial vertical farm LED installation – maximum uniformity and coverage
The PAR Trap: Why WattaPer Square Meter Is the Wrong Metric
Walk into any grow light negotiation and the supplier will throw out numbers like “600W” or “2.5 μmol/J.” These are efficiency metrics, not performance metrics. They tell you how efficiently the fixture converts electricity into photosynthetically active radiation—which is useful, but only after you know whether your plants are getting enough of the right light in the right places.
PAR (Photosynthetically Active Radiation, 400-700nm) is the foundational concept, but it’s a starting point, not a finish line. Within that 400-700nm range, different wavelengths drive dramatically different physiological responses. Blue light (400-500nm) regulates stomatal opening, leaf expansion, and secondary metabolite production. Red light (600-700nm) dominates photosynthesis efficiency. Far-red (700-800nm) controls shade avoidance responses—the mechanism that determines whether your plants grow tall and leggy or compact and productive.
If your supplier’s spectrum chart only shows a broad “PAR” band, that’s a red flag. You can’t evaluate spectrum quality without seeing the actual wavelength distribution within PAR.
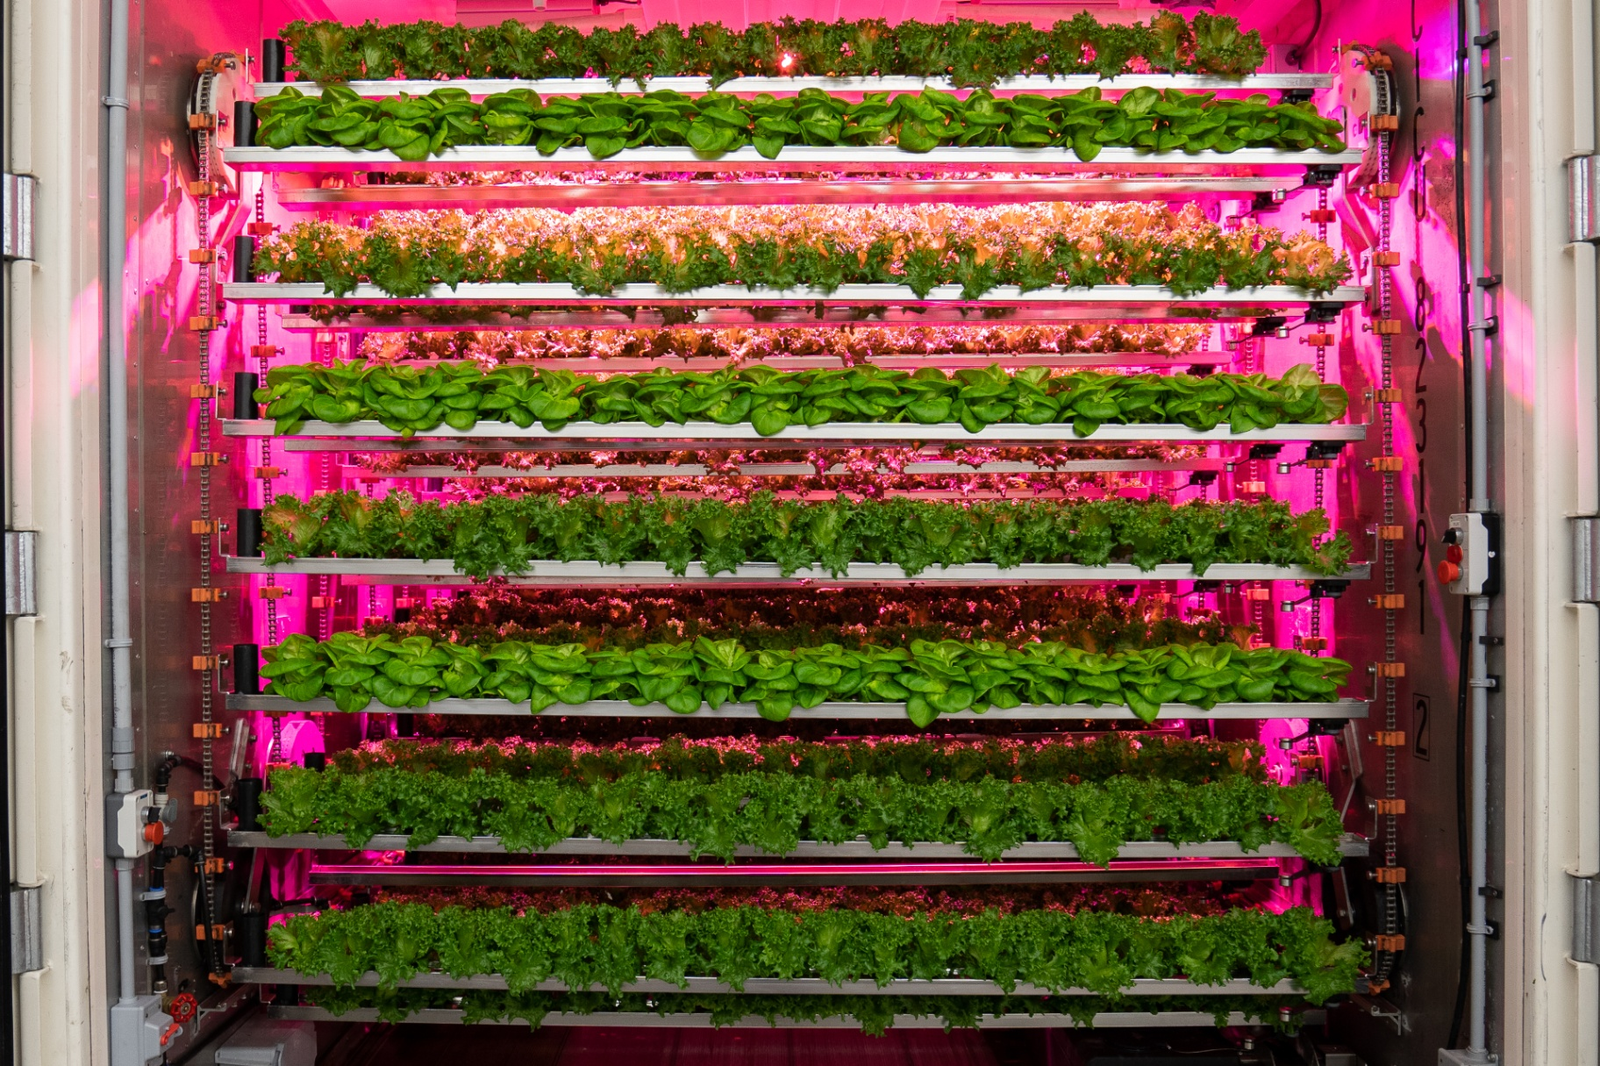
Indoor vertical farming system with LED grow lights – multi-layer cultivation
PPFD Maps: The Only Spec That Actually Matters
PPFD (Photosynthetic Photon Flux Density, measured in μmol/m²/s) is the real performance metric. It tells you how many photons actually hit your plant canopy per square meter per second. One number on a datasheet doesn’t tell you anything—you need a PPFD map showing light distribution across the growing area.
For commercial operations, here are the numbers I use as benchmarks:
Leafy greens (lettuce, basil, spinach): 150-350 μmol/m²/s for vegetative growth
Herbs (mint, cilantro): 200-400 μmol/m²/s
Tomatoes (fruiting stage): 500-900 μmol/m²/s
Cannabis (vegetative): 400-600 μmol/m²/s
Cannabis (flowering): 800-1200 μmol/m²/s
But PPFD alone isn’t enough either. You need to know your uniformity ratio—the ratio of minimum to average PPFD across your canopy. A fixture that delivers 500 μmol/m²/s average but only 200 μmol/m²/s in the corners is worse than one that delivers a consistent 350 μmol/m²/s everywhere. For uniformity below 0.7, you’ll get uneven crop maturity and wasted product.
Most cheap import fixtures have terrible uniformity because they use low LED count designs with poor optic engineering. YoubeeLight’s commercial grow light fixtures use multi-point source designs with proprietary reflector geometry that achieves ≥0.8 uniformity at working distances of 30-60cm—a spec that actually matters for tray-based production.
DLI: The Metric Nobody Talks About Until the Crop Fails
DLI (Daily Light Integral, measured in mol/m²/day) is the accumulation of PPFD over the entire photoperiod. This is where most commercial growers get caught.
A fixture delivering 300 μmol/m²/s for 18 hours gives you a DLI of 19.4 mol/m²/day. Drop that to 12 hours (common with energy-saving dimming protocols or poor driver design), and your DLI drops to 12.96—roughly a 33% reduction in daily light dose. Your plants won’t show obvious stress in the first week. They’ll just grow 30% slower, and you’ll spend months figuring out why your yield projections were wrong.
For reference:
Low DLI crops (<10 mol/m²/day): Sprouts, some herbs
Medium DLI crops (10-20 mol/m²/day): Lettuce, spinach, most leafy greens
High DLI crops (20-30 mol/m²/day): Tomatoes, peppers, strawberries
Very high DLI crops (>30 mol/m²/day): Cannabis, some cut flower operations
When spec’ing fixtures, calculate your DLI target first, then work backward to required PPFD and photoperiod. If a fixture manufacturer can’t explain how their product meets your DLI target, they’re selling lights, not lighting solutions.
Spectrum Ratios: The Real Variable Behind Crop Quality
Once you have the PPFD and DLI sorted, spectrum ratios become the variable that controls crop quality—flavor, aroma, compactness, flowering time, and nutritional density.
The R:FR ratio (Red to Far-Red, typically 660nm to 730nm) is the most commercially significant. A high R:FR ratio (above 2:1) promotes compact, vegetatively driven growth. When FR increases relative to R, plants trigger shade avoidance—stem elongation, leaf expansion, reduced branching. For vertical farming with stacked racking, you often want shade avoidance suppressed, which means R:FR ratios above 3:1 at the canopy.
Blue:Red ratios control morphology more broadly. High blue (15-30% of total PAR) produces compact, structurally robust seedlings. Too little blue (<10%) and you'll get stretched, fragile plants regardless of how much total light you provide. Many cheap full-spectrum fixtures achieve their "sun-like" appearance by cranking up green and white LEDs while skimping on blue—the result looks impressive on camera but produces inferior crops.
For our commercial clients running mixed crop operations, YoubeeLight offers tunable spectrum fixtures where R:B ratios can be adjusted from 2:1 to 5:1 via DMX or Casambi protocols, without changing total PPFD. That’s the kind of flexibility you actually need in a commercial environment.
Modern indoor agriculture grow room with spectrum-tuned LED lighting
The Electrical Reality Nobody Screens For
Before closing, one operational issue that destroys grow light ROI faster than bad spectrum: driver reliability in high-temperature environments.
Grow rooms are hot. Above canopy temperatures of 28-32°C are common in sealed vertical farms. LED drivers lose efficiency and lifespan dramatically above 60°C case temperature. A driver rated for 50,000 hours at 25°C might deliver only 15,000 hours at 35°C ambient. At 40°C, you’re looking at 8,000-10,000 hours—less than a year of continuous operation.
IP rating matters here too. Water and nutrient runoff in grow rooms create condensation risk. Fixtures should be IP65 minimum for overhead mounting in active growing environments. IP54 is insufficient if you’re running any overhead irrigation or humidification cycles.
Get the thermal data from your supplier. Ask for driver case temperature at maximum ambient. If they can’t provide it, walk away.
Sourcing Takeaway
Spectrum marketing is ahead of spectrum science in the commercial LED grow light market. The gap is where your procurement mistakes live. Focus on PPFD maps and uniformity ratios, not “full spectrum” claims. Calculate your DLI target before touching any datasheet. Evaluate spectrum ratios against specific crop responses, not aesthetic chart shapes. And get the thermal data before you sign a PO.
For a deeper look at our full grow light range and fixture specifications, visit YoubeeLight’s LED catalog. If you’re planning a commercial installation and want to discuss crop-specific specs, our project lighting team has experience across leafy greens, herbs, cannabis, and vertical farming operations.