
LED Lumens Per Watt: The Efficiency Number That’s Misleading Half Your Suppliers
When a supplier tells you their LED fixture does 150 lumens per watt, they’re not lying—but they might be misleading you anyway.
Lumens per watt (lm/W) is the standard measure of LED energy efficiency. Higher is better, right? In theory, yes. In practice, it’s one of the most commonly abused specifications in commercial lighting. I’ve seen $15 fixtures claim 180 lm/W and $200 professional fixtures rated at 130 lm/W—and the expensive ones were the better value.
Here’s why, and what to actually look for.
The Problem With Peak Efficiency Numbers
LED chip manufacturers publish maximum lumens per watt figures measured under ideal laboratory conditions: specific temperature (25°C), specific current (usually 350mA), specific test time. These numbers are real, but they’re not what your installation will experience.
Real-world conditions:
– Junction temperature: Every 10°C above 25°C reduces LED efficiency by roughly 1-2%. In a enclosed fixture running at 60°C junction temperature, you’re already 5-7% down from the peak number.
– Driver losses: The LED driver converts AC to DC and typically loses 5-15% in the process. A fixture that claims 150 lm/W from the LEDs might deliver 130 lm/W system efficiency.
– Optical losses: Lenses, diffusers, and reflectors typically absorb 5-20% of light before it exits the fixture. That “150 lm/W fixture” might only give you 120 system lumens per watt.
– Thermal throttling: Many budget fixtures run their LEDs at reduced current when they overheat, which drops efficiency further after the first few minutes of operation.
System Lumens Per Watt vs. Source Lumens Per Watt
This is the critical distinction that separates informed buyers from those who get burned.
Source lumens per watt = LED chip efficiency measured in a lab. Useful for comparing chip generations and manufacturers, but meaningless for actual installation performance.
System lumens per watt = Total light output from the fixture divided by total electrical input. This is what matters in your project.
A real example from my experience: A client compared two high-bay fixtures. Supplier A quoted 155 lm/W. Supplier B quoted 130 lm/W. Supplier A’s fixture was cheaper per unit. After thermal testing in their actual warehouse conditions (45°C ambient, enclosed fixture), Supplier A’s system delivered 95 lm/W. Supplier B’s delivered 115 lm/W. Over a 200-fixture installation with 12-hour daily operation, Supplier B’s “lower efficiency” fixture saved $8,400 per year in electricity.
The higher-efficiency chip manufacturer wins on the spec sheet. The better-engineered fixture wins in your building.
What LM-79 Reports Actually Tell You
Any serious LED manufacturer should provide LM-79 test reports for their fixtures. This is an IES (Illuminating Engineering Society) standard for measuring LED lighting products. If a supplier can’t provide LM-79 reports, that’s a red flag—either they haven’t tested their products or the numbers won’t survive scrutiny.
From an LM-79 report, the number you want is total luminous flux and total input power—these give you system lumens per watt.
What the LM-79 report won’t tell you: thermal performance over time. That’s where LM-80 testing comes in. LM-80 measures LED lumen maintenance over 6,000, 10,000, or 18,000 hours. This is the basis for L70 B50 ratings—the industry standard for claiming how long an LED fixture will maintain at least 70% of its original output.
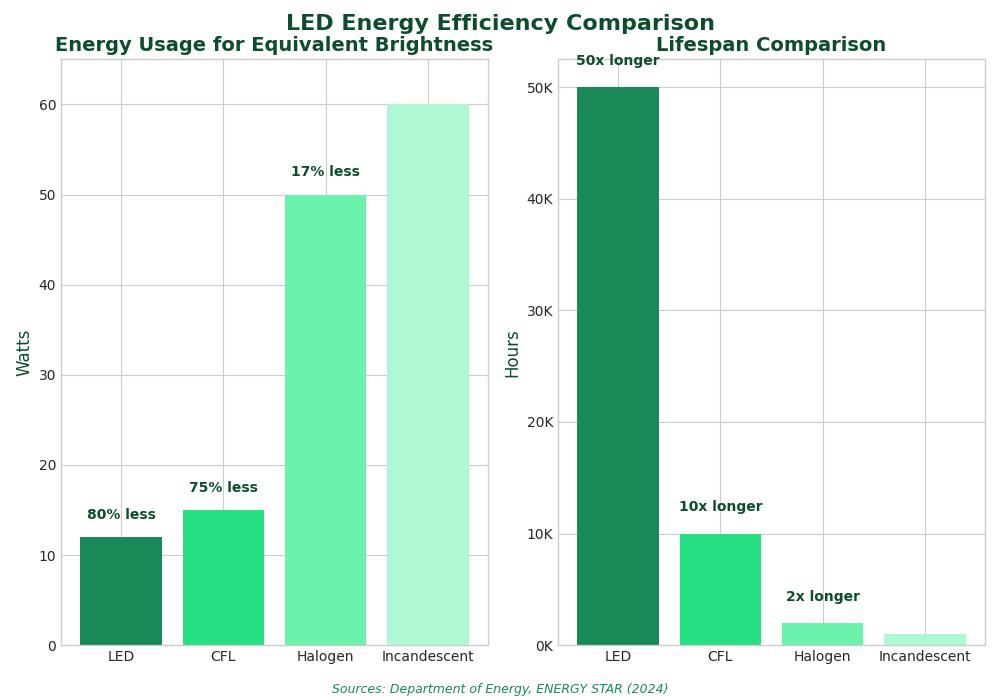
Here’s a practical number to know: a quality LED fixture with good thermal management should maintain L70 for 50,000-60,000 hours. That’s roughly 12 years at 12 hours per day. Budget fixtures often only achieve L70 at 25,000-30,000 hours—about half the lifespan. The efficiency “savings” from buying cheaper fixtures disappear when you’re replacing them twice as often.
The Dirty Secret of “High Efficiency” Budget Fixtures
Here’s a practice I’ve seen more frequently since Chinese manufacturers started pushing into the high-efficiency market: cherry-picking test conditions.
A fixture gets tested at 120V input, 25°C ambient, and a specific operating mode that maximizes output. The resulting efficiency number gets printed on the product page. The test report exists and is technically accurate. But it doesn’t reflect how the fixture will perform in your installation.
Specific tricks I’ve observed:
– Cool white bias: Testing with 6500K cool white LEDs (higher efficiency) rather than the 4000K neutral white the project actually needs (lower efficiency by 10-15%)
– Short-duration testing: Running the test before thermal equilibrium is reached, capturing initial efficiency before heat buildup degrades output
– Driver mismatch: Testing the LED module at optimal current, then pairing it with an inefficient driver that loses more power in conversion
– Open fixture testing: Testing LEDs without the housing that will trap heat in actual installation
If you’re sourcing from a new supplier or a supplier you haven’t vetted, ask for thermal imaging of the fixture under load and request a third-party lab test of the actual delivered system efficiency.
Comparing Efficiency Across Fixture Types
Efficiency benchmarks vary by fixture type. Here’s what I use as a practical reference for commercially available fixtures in 2026:
| Fixture Type | Typical System lm/W (Quality) | Budget Range | Premium Range |
|---|---|---|---|
| Linear strip (office) | 130-160 | <120 | 160-200 |
| High bay | 130-155 | <110 | 155-175 |
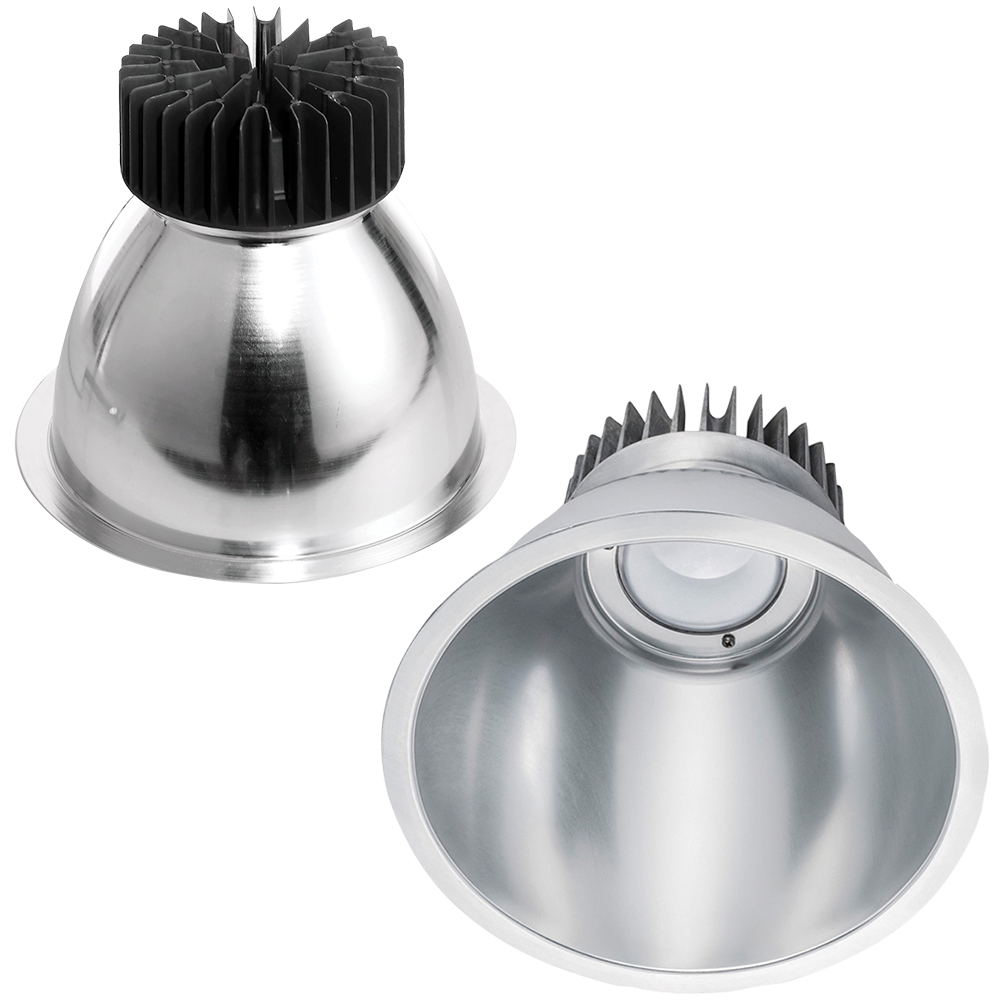
| Downlight | 80-120 | <70 | 120-140 |
| Floodlight | 120-145 | <100 | 145-165 |
| Tri-proof | 125-150 | <105 | 150-170 |
Fixtures at the top of these ranges often use premium LED chips (e.g., Lumileds, Seoul Semiconductor, Samsung) combined with high-efficiency drivers and optimized optics. The cost premium is typically 20-40% over standard fixtures, but the efficiency advantage compounds over the fixture lifespan.
The Energy Code Reality
In the US, Title 24 (California), ASHRAE 90.1, and various state energy codes are getting stricter. ASHRAE 90.1-2022 now mandates lighting power densities that are pushing many projects toward high-efficiency fixtures just to comply.
In the EU, the Ecodesign regulations have effectively banned the least efficient lighting products. The result is that 120 lm/W system efficiency is becoming the floor, not the ceiling, for commercially viable products.
For LEED projects and other green building certifications, lighting efficiency directly affects your energy model. Every 10 lm/W improvement in system efficiency is roughly 7-10% reduction in lighting energy consumption. Over a 20-year building lifecycle, that adds up.
My Practical Specifying Approach
For high-volume projects (50+ fixtures):
1. Request LM-79 reports and verify system lumens per watt matches the quoted number
2. Ask for LM-80 reports and verify L70 ratings meet your project lifespan requirements
3. Request thermal test data showing fixture performance at your installation’s ambient temperature
4. Calculate total cost of ownership: fixture cost + (watts × hours/year × electricity rate × years × replacement factor)
For smaller projects:
1. Verify the efficiency claim is for the complete fixture (not just the LED chip)
2. Compare warranty periods—a 5-year warranty on efficiency is a stronger claim than a 2-year warranty
3. Look for DLC (DesignLights Consortium) certification if the project is in North America—DLC tests and verifies performance claims independently
4. Ask the supplier what LED chip manufacturer they use. Premium chips (Lumileds, Cree, Samsung, Seoul Semiconductor) typically deliver closer to their rated efficiency
Never do:
– Buy on source lumens per watt alone
– Accept efficiency claims without test reports
– Assume thermal performance will match laboratory conditions
– Ignore driver efficiency—it’s part of the system
At YoubeeLight, we provide LM-79 and LM-80 test data for all commercial fixtures. Our /led-catalog/ includes high-efficiency LED products tested for real-world thermal performance. Visit /about-us/ to discuss efficiency requirements for your specific project.
