
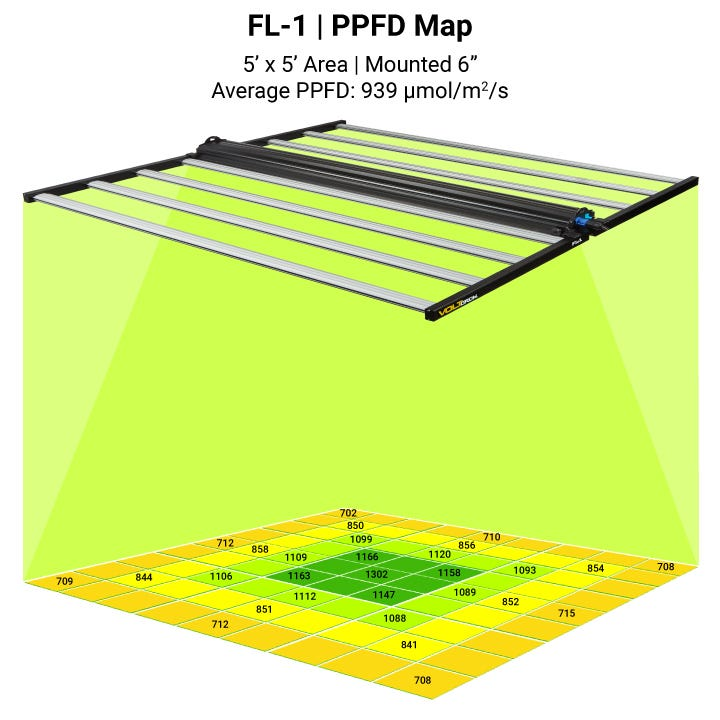
LED Grow Light PPFD/DLI: The Numbers That Actually Matter for Commercial Growers
If you’re sourcing grow lights for a commercial operation and someone leads with “full spectrum” without discussing PPFD and DLI, walk away.
These aren’t marketing buzzwords. They’re the actual metrics that determine whether your crops make money or become expensive compost.
The Problem with “Full Spectrum” Sales Pitches
I see it constantly in trade shows: manufacturers waving around rainbow spectrum charts like they’re selling lava lamps. “Our light has 380nm to 780nm!” they announce proudly.
So what?
What actually matters is micromoles per second hitting your canopy. Not the theoretical range. Not the theoretical spectrum. The actual photons your plants receive.
Most buyers don’t push back because they don’t know what to ask. That’s exactly why spec sheets get away with listing theoretical output rather than actual performance data.
The two numbers you need to demand:
- PPFD Heatmap at Working Height – Not at 12 inches. At the distance your plants will actually sit.
- DLI Calculation for Your Specific Configuration – Daily Light Integral, in mol/m²/day.
What PPFD Actually Tells You
PPFD (Photosynthetic Photon Flux Density) measures micromoles of photons hitting one square meter per second (μmol/m²/s).
A typical 600W HPS throws about 900-1000 μmol/m²/s at the sweet spot. Good LED fixtures should hit 1200-1500 μmol/m²/s at similar distances while using 40% less power.
Here’s what nobody tells you: PPFD isn’t uniform across your growing area.
Cheap fixtures have massive hot spots. You might see 1400 μmol/m²/s under the center driver and 600 μmol/m²/s at the edges. That’s a 2:1 ratio. Your plants under the edges will stretch and underperform.
Acceptable uniformity ratio: 1.3:1 or better.
When evaluating Chinese manufacturers, ask for the actual PPFD heatmap. If they send you a chart that looks suspiciously perfect (even coverage everywhere), be suspicious. Real heatmaps show variation. The good ones just show less variation.

DLI: The Number That Predicts Yield
Here’s where most buyers drop the ball.
PPFD tells you intensity at any moment. DLI tells you total daily light dose.
DLI (Daily Light Integral) is calculated as:
DLI = PPFD × Photoperiod × 3,600 / 1,000,000
For example:
– 800 μmol/m²/s × 16 hours = 46.08 mol/m²/day
– 1200 μmol/m²/s × 16 hours = 69.12 mol/m²/day
Different crops have different DLI requirements:
– Leafy greens (lettuce, basil): 17-30 mol/m²/day
– Fruiting vegetables (tomatoes, peppers): 30-50 mol/m²/day
– Cannabis (vegetative): 40-60 mol/m²/day
– Cannabis (flowering): 50-80 mol/m²/day
When sourcing for vertical farms, this is critical. If you’re stacking 6 layers, the bottom layers might only receive 40% of the top layer’s light. Your DLI calculation needs to account for this.
Question to ask your supplier: “What’s the PPFD at each layer in a 6-tier vertical rack at 18-inch spacing?”
If they can’t answer, they haven’t done the engineering work.
Spectrum Specifics That Actually Matter
Forget the marketing. Here’s what the research actually shows:
Blue light (400-500nm): Controls stomatal opening, leaf expansion, chlorophyll production. 15-25% of spectrum is generally sufficient.
Red light (620-680nm): Most efficient for photosynthesis. This is where your ROI lives. Expect 40-50% red in efficient fixtures.
Far-red (700-780nm): Triggers shade avoidance response. Small amounts trigger beneficial stretch in seedlings. Too much causes leggy growth.
UV (280-400nm): Increases secondary metabolite production (flavonoids, terpenes). Important for medicinal herbs and high-value crops. Often omitted in cost-optimized fixtures.

The Real Cost Calculation
When comparing fixture costs, calculate:
- μmol per dollar = Total μmol output / Fixture cost
- μmol per watt = Total μmol output / Wattage draw
- Cost per μmol delivered = Fixture cost / (PPFD × Coverage area)
A fixture that’s $50 cheaper but delivers 20% less PPFD over your canopy costs you more in the long run than a fixture with better performance.
Rule of thumb: Commercial grow lights should deliver 1.5-2.5 μmol/J (micromoles per joule of electricity). If a manufacturer can’t provide this number, assume it’s below 1.5.
What to Demand from Your Supplier
When sourcing from manufacturers (especially from China), request:
- IES file for photometric distribution modeling
- PPFD heatmap at multiple mounting heights (at least 12″, 18″, 24″)
- Independent lab test reports (not self-certified)
- DLC certification (if selling into North America)
- Real PPFD readings from their own facility, not just theoretical calculations
The manufacturers who refuse to provide this data have something to hide. The ones who provide it enthusiastically are proud of their performance.
The difference in crop yield between a properly specced lighting system and a budget system can be 30-50%. That difference pays for quality equipment in one growing cycle.
Final Thoughts
I’ve seen vertical farms fail because someone bought based on wattage instead of PPFD. Wattage tells you electricity consumption, not light delivery.
The conversation you should be having with your supplier isn’t “what wattage?”
It’s “what PPFD at working height, across my entire canopy, in my specific configuration?”
Get that answer in writing. Then compare it against your DLI target.
Everything else is just pretty colors.
